
From a multi-gigabyte price file to an exact out-of-pocket
We took one insurer's Transparency-in-Coverage file, one common surgery, and one Houston ZIP code — and turned them into the number members actually want: what will I pay at each hospital near me?
Price transparency files are famous for being unusable: multi-gigabyte JSON, legal-entity names nobody recognizes, and rates that need context before they mean anything. But buried in that noise is the answer to the only question a patient actually asks: "what will this cost me, there?"
We ran the full exercise end to end on real data. One insurer's in-network file. One everyday operation — laparoscopic gallbladder removal, CPT 47562. One member ZIP code in Houston, with a 20-mile radius.
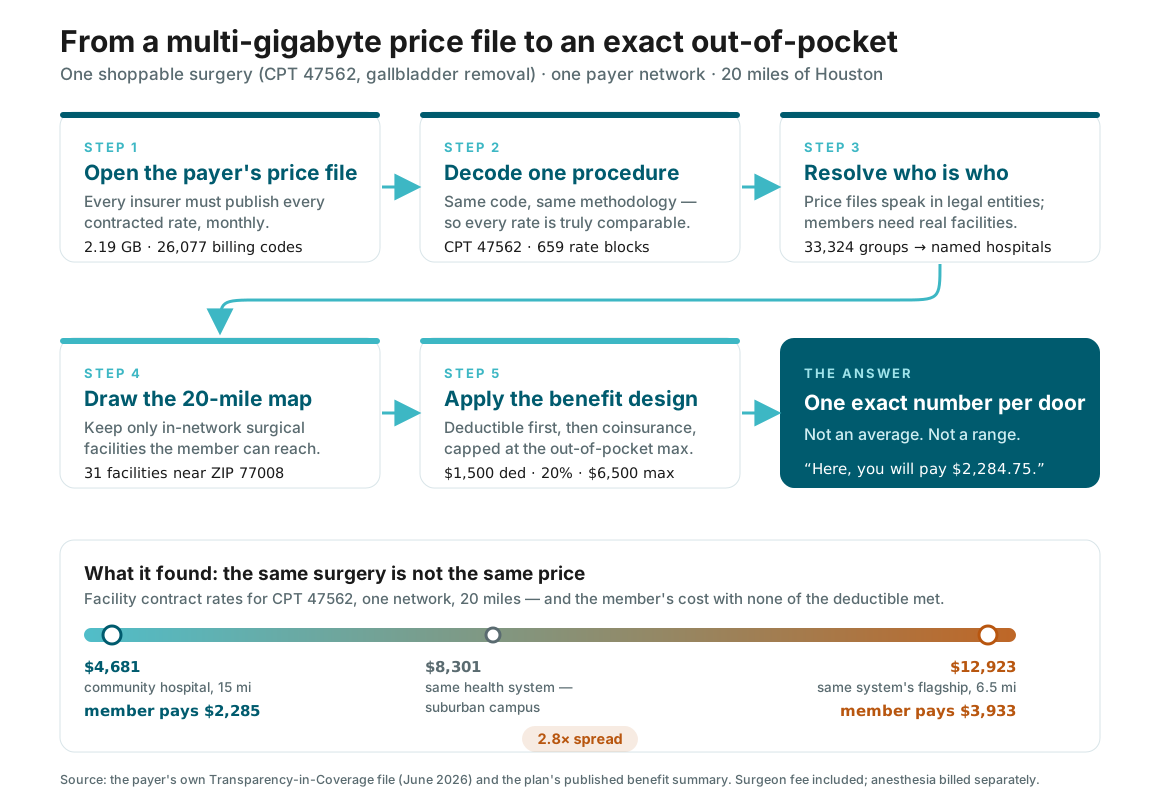
The five steps, honestly described
1. Open the payer's file. The June file for this network happens to be 2.19 GB compressed and holds 26,077 billing codes — and that makes it one of the manageable ones. These files range from a few megabytes to well past 100 GB each, and across all payers and plans the monthly publication runs to terabytes — the full national corpus into petabytes. Streaming this one takes about a minute; nothing here requires heroic infrastructure. The barrier isn't size — it's the next three steps.
2. Decode one procedure. All 659 rate entries for CPT 47562 live in one place, but they mix billing classes (hospital vs. surgeon) and methodologies (flat negotiated rates vs. percent-of-charges). Comparing across methodologies is how transparency projects go wrong. We kept the flat facility rates — the ones that are genuinely comparable — and set aside the rest, on purpose.
3. Resolve who is who. This is the step everyone underestimates. Price files speak in legal entities: the file's "Pipeline East Dallas LLC" is actually a neighborhood hospital on Ashland Street in Houston Heights. Its "Baytown Medical Center LP" operates on West Tidwell Road — nowhere near Baytown. Without a provider-identity crosswalk, a shopping tool shows members names they've never heard of at addresses that don't match. With one, 33,324 provider groups collapse into a clean list of named facilities.
4. Draw the map. Within 20 miles of the member's ZIP, 31 in-network hospitals and surgery centers hold a flat contracted rate for this operation.
5. Apply the benefit design. We used the plan's own published cost-share — a $1,500 deductible, then 20% coinsurance, with a $6,500 out-of-pocket maximum — and assumed the member hasn't met any deductible yet. Deductible first, coinsurance on the rest, cap applied. That's not an estimate engine; it's arithmetic.
What it found
Same surgery. Same insurer. Same 20 miles.
- Community hospital, east side — contracted rate $4,681 → member pays $2,285
- Large system, suburban campus — contracted rate $8,301 → member pays $3,009
- Academic flagship, Texas Medical Center — contracted rate $12,923 → member pays $3,933
Member cost = facility rate plus the typical in-network surgeon fee, deductible unmet. Anesthesia is billed separately by time.
The spread is 2.8× on the facility contract — and the most striking line isn't the cheapest-versus-priciest comparison. It's that the same health system prices the same operation $4,622 apart at two of its own campuses. A member choosing by brand name alone cannot see that. A member with this list sees it in one glance — and keeps about $1,650 by driving fifteen minutes further.
Why "exact" is the honest word — with three caveats
The rates are exact: they're the contracted amounts in the payer's own federally required file. The cost-share is exact: it's the plan's published design. What keeps the final number from being a guarantee is scope, and a trustworthy tool says so on the page: anesthesia rides separately, percent-of-charge contracts can't be resolved to a dollar figure in advance, and a member's remaining deductible has to come from either the member or — soon — the payer's own CMS-mandated patient-access APIs, which make this math fully automatic.
What this means if you run a hospital
This analysis took one afternoon with public files. Payers, employers, and navigation vendors are building exactly this view of your market — with your rates in it. If your flagship campus is the expensive dot on someone else's diagram, you want to know before your volume does. And if you're the $4,681 hospital nobody has heard of, transparency is the best marketing you'll never have to buy.
Either way, the first move is the same: see your own position in the file the way everyone else sees it.